Calculating the cost of a stockout

From logistics, delays, product returns, and “spilled orders” to customer trust and brand loyalty.

Why do some customers keep coming back to the same brand? Chances are, it’s because that business delivers a promised level of satisfaction and fulfillment. Simply, its products are consistently available when its customers desire them. When customers buy from you, they’re placing trust that your brand fulfills their needs.

Customers start to lose faith when you can’t meet those expectations, whether due to stockouts or other fulfillment issues. They may even decide to take their business elsewhere. A study by Boston Consulting Group found that 43 percent of customers say they would leave a company after just one bad experience.

A recent report from Bain & Company, along with Earl Sasser of the Harvard Business School, also discovered that increasing customer retention rates by just five percent might lead to an increase in profits ranging from 25 percent to 95 percent. Correspondingly, when companies can reduce their customer churn rate by five percent, it results in a 25 to 125 percent increase in profits.

What can you do to maintain customer loyalty?

An excellent place to start is improving your supply chain and fulfillment processes to experience fewer product stockouts. Understanding stock availability levels – and your associated fill and cancel rates – is an important beginning. With this visibility, you may take steps to correct purchasing errors and improve forecasting, so products are consistently available when customers need them.

Quantify your stockout costs

Importantly, stockouts carry real and attributable costs that can be defined. These include: increased shipping costs, return costs, cancellation costs, lost revenue from  “spilled” orders (i.e., orders lost to stock unavailability), and, of course, the costs associated with customer attrition due to brand dissatisfaction.

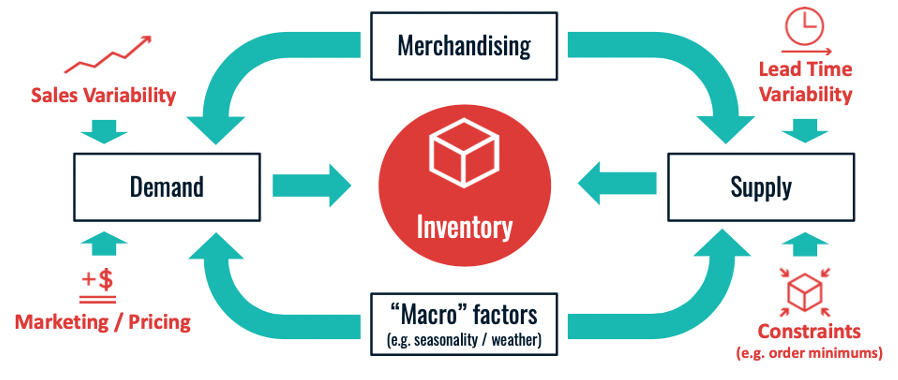
In the simplest terms, excess stockouts occur when your inventory can’t cover the expected variability in your demand. . Inventory optimization is your buffer against the natural uncertainty of supply and demand.

Inventory_merchandising

Begin by considering:

Your stock availability rate

Stock availability or in-stock rate measures the percentage of expected demand that you have in-stock and available for sale.

For example, if a SKU has a daily forecast of 2 customer orders for every ten units, and there are 20 units in-stock, we count that item as “in stock” for that day, a 100% availability rate. Learn more about how to calculate in-stock rates here.

Your fill rate

Fill rate is the percentage of actual demand from customers that you were able to fill immediately from inventory on the shelf.

For example, if today two customers order a SKU at five units each, and there are only five units in stock, our fill rate is 50%. Learn more about how to calculate your fill rate here.

Your cancel rate

This is the percentage of demand canceled out of all demand. As you analyze your canceled orders over a set period of time, make sure to not count orders fulfilled later as cancels too.

Learn More

Local stockout considerations

Most people think of stockouts occurring only when there is no inventory available in their entire supply network (we would refer to this as a “global stockout”). Though “global stockouts” are problematic and certainly expensive, we find that “local stockouts” are just as insidious.

With a local stockout, the SKU is not available at the optimal distribution center closest to the customer. This means that at a minimum, the order will travel further, at higher cost, with longer delivery time and a higher chance of damage. More importantly, on multi-line orders, orders can become split into multiple shipments arriving over multiple days. This is not only more expensive – it’s also less convenient for the customer.

If your business does not permit splitting orders and instead holds orders to ship complete then an order will be delayed until the right item is in-stock at your local distribution center (which could have also required a one-off transfer from the facility that did have inventory). When local stockouts impact multi-line orders, the shipping and delivery time costs compound greatly.

Of course, a measurable percentage of delayed shipments resulting from local stockouts will be canceled during leadtime, adding both return shipping and other restock costs to the lost sale itself.

Moving beyond these tactical financial consequences, a more strategic calculation of stockout costs may be understood by quantifying what we call “spilled” orders – those sales lost when a customer chooses to NOT buy due to stock unavailability.

Calculating “spilled orders”

Quantifying the value of your spilled orders – orders lost when customers can’t buy unavailable products – represents the most significant portion of stockout costs.

Follow the three steps below for a designated range of SKUs to calculate this spill. (For organizations new to spill rate concepts, we recommend starting with a discreet product line, or perhaps a single vendor.)

1. Gather study data for a discreet inventory range and time period

• We’d recommend compiling your daily available quantities for your SKUs for at least 30 days.

• For this same period, find your daily sales history for these SKUs.

2. Filter this inventory data to only include items that had days of available inventory for sale (in-stock days) as well as days without inventory available for sale (out-of-stock days).

• From your daily stock quantities, identify and include only those items with at least one global in-stock and one global out-of-stock day during your study period. Then correlate your daily sales histories for these same items. Combine your filtered sales and filtered inventory data for final calculations into a single data set.

3. Analyze your data to calculate spill cost and spill rate

• Calculate the average sales per day during your study period for each SKU when in-stock and when out-of-stock. The sales difference between in-stock and out-of-stock days is the spill cost for that item during the period.

• When you represent this sales difference between in-stock days and out-of-stock days as a percentage, you find your spill rate (the percentage of sales lost when out of stock) – an incredibly useful and powerful metric for your inventory optimization strategies.

What about intangible stockout costs?

Finally, it’s also essential to calculate the intangible costs associated with your stockouts, such as managing cancellations or backorders, as well as those related to diminished brand reputation.

Key factors to consider with cancellations include service calls, product returns, and unsaleable stock. For your brand, it’s crucial to quantify impacts on customer lifetime value too.

In our experience, these “intangible” costs typically range as high as 5% of revenue for high-stockout product lines.

Learn More

Adding it all up

It is without question that all businesses understand stockouts have a “cost” which includes additional shipping, customer dissatisfaction, return and cancellation processing, and lost revenue. However, having tangible data that explicitly states these stockout costs can be invaluable when designing inventory strategy. For example, to know that $1M in added inventory will increase fill rate by 5% and result in a $10M revenue bump makes the decision to add that inventory a no-brainer.

The focus of this blog has related explicitly to calculating spilled orders or lost revenue when out of stock because this is often the largest stockout cost, but the hardest to determine.

Here’s a simple example utilizing a $10 fixed cost for every spilled or lost order.

Inventory_Chart

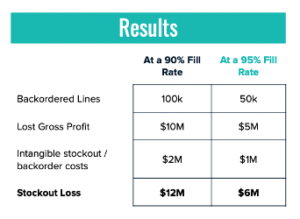
As you can see with this analysis, the costs quickly add up. For an organization with $100M in inventory and a 50% spill rate, the financial impacts of just a 5% fill rate increase equate to $6M.

Optimization_results

Cost of Stockout: Dollars and sense

When stockouts occur, there are many costs, ranging from readily tangible additions for freight, shipping delays, and customer returns to measurable yet less apparent financial impacts from tarnished brand reputations and diminished customer loyalty.

Again, in our experience, just the brand and customer loyalty costs typically amount to nearly 5% of revenue for stockout product lines.

At Hydrian, we understand that stockouts carry real and attributable costs and that fully quantifying them is a vital first step for any business’s inventory optimization journey.

Powered by our proprietary AI tech built upon decades of experience, we begin with a no-cost Inventory Assessment.

Hydrian’s supply chain, analytics, and data-science experts then act as an extension of your team. Together, we develop achievable goals to optimize your inventory and work with you to accomplish them.

Let’s get started.

Inventory optimization done for you

There’s nothing else like Hydrian’s expertise, technology, strategy, and daily support.

If you feel like your inventory challenges are hopelessly out of control, Hydrian can help.

Managing variable supplier lead-times, dynamic demand, and snarled supply chains across broad distribution networks is immensely complex and typically involves a high volume of day-to-day inventory tasks.

Time and again, we hear that this daily volume quickly overwhelms strategic inventory considerations. We also know that few ERPs and purpose-built inventory optimization software packages provide the right reports to forecast what’s coming next.

The truth is: Inventory optimization is a complicated business.

However, we’re here to tell you that effectively managing your purchasing while delighting your customers is indeed achievable.

Hydrian’s team of experienced operational experts, data scientists, and proprietary AI technology, work together to augment your purchasing capabilities by providing operational strategy paired with daily actionable recommendations. Before you start a paid engagement, we start with a comprehensive, no-cost inventory assessment.

Our process works like this:

• Initial no-cost inventory assessment to deeply understand current performance

• Strategic inventory recommendations with bona fide ROI

• Daily actionable recommendations for managing your inventory, with weekly or monthly delivery of metric reporting to track progress.

It’s inventory optimization done for you, and you can get started here.

Better yet, with Hydrian, there are no new systems to buy, no new staff to hire, and no long-term contracts.

As we work together, your fill rates will go up, your customers will be happier, you’ll grow your company’s bottom line, and… you’ll finally get the help you need.

How do we get started?

Hydrian’s No-Cost Inventory Assessment

We start by gathering a standard set of data that includes inventory positions, sales, and receiving data readily available from any ERP via regular reports and exports. Our “integration-less” method means we accept the data we need from any system and in any format.

Because Hydrian’s data flow does not require any integrations or APIs, you continue to use your current systems with our service. There’s no new software to buy. No disruptive implementations. No systems investment of any kind.

We then unleash our powerful algorithms and data scientists to turn your data into insights that reveal current inventory performance, opportunities for improvement, and the associable ROI for your most pressing inventory challenges.

For example, one of the first parts of our analysis is what we call your “efficient curve.” This representation plots how your inventory investment, fill rate (or service level), and operational costs interact for your unique mix of products. The fundamental insight is the optimal inventory investment required to meet your fill rate goals.

Time and again, our customers tell us that seeing our free assessment begins the process of lifting the inventory weight off their shoulders because, for many, this presentation puts bounds around their world of possibility for fill rate, inventory investment, excess stock and much more. For the first time, their fulfillment and logistics woes seem truly solvable.

This analysis also helps remove the personal stress that many inventory pros feel as they tackle their jobs’ daily volume. No longer does the inventory onslaught manage you.

Contact us for your no-cost inventory assessment today!

Strategic Inventory Recommendations for You

Using your data in conjunction with our operational expertise, Hydrian is able to build and provide a set of strategic inventory directions.

We provide impactful strategy both as part of your initial assessment and – when you proceed with Hydrian for ongoing inventory optimization support – regularly throughout our service with you. (More about that below.)

Our strategic recommendations during the no-cost assessment include:

• How to think about measuring excess inventory

The cost (revenue loss) of stockouts

• Insights into stock availability

• Plausible inventory sell-down strategies

• Considerations for managing current excess stock

Additional guidance such as:

• How to think about rebates

• How to think about moving to or improving a hub and spoke model

• How to think about where to open a new distribution center

The best part is that our assessment recommendations almost always result in a 5 to 10x ROI over our proposed fixed monthly fee to help you execute them. If we can’t forecast a 5 to 10x ROI for you, we’ll discontinue the sales process – no sense in spending both our resources if the juice won’t be worth the squeeze.

Once we begin working with you, the limits of our strategy recommendations are not contained to only the above. We help our customers with all purchasing-centric challenges.

Remember, with our initial, no-cost inventory assessment you incur no risk with Hydrian. Our team uses the data from your systems to deliver inventory optimization recommendations that make a real difference for your business.

If, for whatever reason, you decide not to proceed with Hydrian at this point, you’ve spent no money, but you’ve gained insights into your business you may not have otherwise seen.

That’s a pretty good deal.

So, what’s next?

Daily Actionable Recommendations.

When customers engage with Hydrian, they love that we become an extension of their teams.

We work with your teams every day by presenting daily actionable recommendations to help you achieve consistent peak inventory efficiency. Our consultants are even available to perform these tasks on your behalf, in your systems, if desired.

Hydrian’s algorithms span the breadth of your data feed to generate explicit purchasing, transfer, and inventory tasks. We share these daily actionable recommendations anyway you would like, but typically they come in two forms: (1) a direct upload into your purchasing system, and (2) an Excel spreadsheet which serves as a to-do list for your team, and supports recommendations already uploaded into your system.

Inventory_Spreadsheet

Your daily actionable recommendations typically include tasks for:

• Purchase orders

• Inventory transfers

• Excess and dead stock actions

Our customers often tell us that their favorite thing about Hydrian’s daily actionable recommendations is how they make their teams feel like they’re no longer alone. Because our daily tasks are specific and easily attainable optimization activities – and because we can even perform them for you – customers say it’s just like we’re an extension of their teams.

This leads to another powerful result.

When the heavy volume of inventory management becomes more automated and predictable with daily actionable recommendations, your team is liberated with more capacity for strategic planning. This force multiplier often builds additional optimization momentum as inventory teams become more efficient and more effective at their roles. Often this empowers our customers to take on other operational leadership projects and initiatives.

Get more info on DAILY ACTIONABLE RECOMMENDATIONS

Ongoing Goal-based Strategic Guidance

In addition to your daily actionable recommendations, we also deliver ongoing, strategic guidance for your inventory based on established inventory goals. Hydrian’s expert consultants will work with you to set these inventory goals, and to build custom reporting to help monitor progress.

Although we enjoy engaging with you tactically every day, we think it’s always highly valuable to make regular time to move beyond these daily tasks to focus on your broad strategy too. Regular check-ins will ensure that your strategies remain agile and current.

Hydrian’s Unique Approach to Inventory Optimization

Hydrian offers inventory optimization done for you, with provable ROI, no new systems to buy, and no commitment.

Hydrian’s strategic insights and daily actionable recommendations for your business are available as a fixed-price, month-to-month engagement with no long-term contract. Not only is your initial inventory assessment free, but we show your expected ROI upfront.

As we work together, you’ll experience:

• Higher revenue with lower stockouts

• Less deadstock

• More free warehouse space

• Lower logistics costs with fewer and shorter shipments

• Enhanced customer service and brand reputation

It’s inventory optimization unlike anything else on the market.

Let’s get started.

Higher demand and longer leadtimes: The COVID “double whammy”

Presented at International Fastener Expo 2021

In early 2020 as COVID swept across the globe, supply chains began to reel as the consequences of the pandemic forced actions such as factory shutdowns and workforce shortages. The resulting leadtime increase led to a jump in order quantities to account for the extended time between receipt of shipments, but between March and May of 2020 there was a massive plummet in demand. All of a sudden businesses had more inventory than they had had in the recent past and half the demand, leading to a tremendous jump in ‘Days on Hand’.

Fortunately, this March to May stretch did not last and demand recovered quickly and continues to climb. The only issue is leadtimes have not recovered like demand, in fact, they have continued to decline. This has led to the opposite problem experienced in March through May as businesses now have declining ‘Days on Hand’ caused by rising demand and inability to get items on the shelf.

The above is obviously applying a broad brush to the current set of issues created by COVID, but is representative of the “general” inventory issues present for most businesses. Using some anonymized client data from Hydrian, it is possible to see how these effects have played out with a real business and lends itself to a discussion on how to mitigate the effects of the current state.

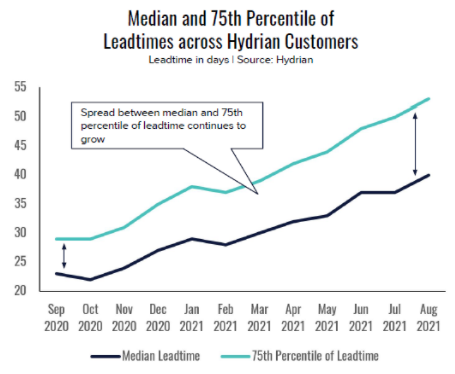
Pulled from actual client data, we can see in the graphic below that since September of 2020, lead times have not only risen but the spread between the median lead time and 75th percentile of leadtime has widened. This means that it takes longer to get what you ordered from your supplier AND the actual count of days you will receive it in is less predictable, culminating in increased inventory values.

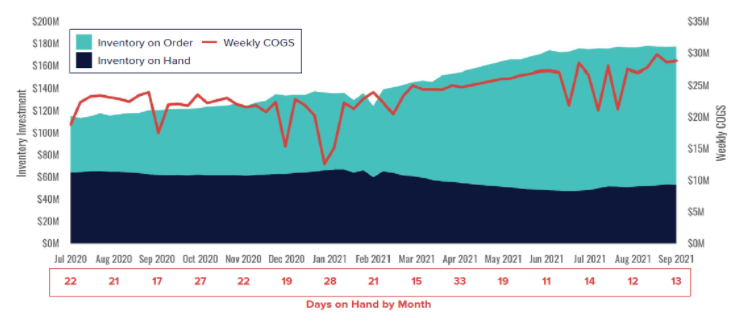
In the chart below, it is clear to see how leadtimes have affected inventory investment. Inventory on order has risen to account for increased demand (shown by the red line), longer leadtimes, and less predictable lead times. However, we also see inventory on hand declining which tells us that receipt of shipments cannot keep up with demand due to these leadtime delays.

With unprecedented ‘inventory on order’ levels, the potential for an “ocean” of excess stock is a real concern if supply chain challenges suddenly resolve themselves. However, what we know about COVID is its impacts are hard to predict, so being prepared to be nimble regardless of circumstances is the new requirement. Below are some strategies to minimize stockouts in the face of huge demand and supply uncertainty and ensure that when lead times do recover and customer demand returns to normal, inventory doesn’t balloon in value due to a bullwhip effect.

1. Develop highly responsive inventory controls (e.g. min/max) and buying strategy

a. As lead times or demand grow, get more inventory “into the pipeline”

b. Conversely, be ready to reverse changes if demand falls or suppliers improve

2. Work with suppliers to adjust PO qtys, push / pull deliveries, and cancel if needed

a. Establish guidelines for “finalization” dates of PO qty, release date, etc

b. Share sales forecasts with suppliers (and ensure they utilize them)

3. Recognize unavoidable excess before it hits your shelf

a. If quantities can’t be changed / cancelled, start liquidating excess before it arrives

b. Consider price reduction, added marketing spend, or other promotion

c. When it makes sense, divert incoming POs to other facilities

4. Track appropriate metrics for measuring supplier and internal performance

a. Track both median / average as well as the distribution of lead times

b. Inventory turns / days on hand, in-stock rates, delivery speed, etc

A link to the full presentation can be found here.

How stockouts impact freight cost

Presented at Home Delivery World 2021

Before beginning, it is important to define two different types of stockouts in a network with multiple distribution centers:

1) Local Stockouts: Out of stock at the “best” or closest distribution center to the customer but in-stock in other distribution centers across the networ

2) Global Stockouts: Out of stock at all distribution centers in the network

There is obviously a cost to global stockouts which is fairly straightforward to understand, but there is also a dramatic cost to local stockouts. Based on experience with our customers, the measurable cost of a local stockout in a national, multiple distribution center network consists of the below, (this does not account for costs associable to intangibles such as diminished brand reputation or customer lifetime lost value): 

• 20% of order lines ship from non-local distribution centers 

• 15% of orders have 2+ shipments due to splits caused by the local stockout

• 2.5 additional zones are traveled on average for non-local shipments at a 20-25% freight cost premium

• 1.8 days of additional delivery time is added on average

• 14% of total outbound freight cost is attributable solely to the local stockout

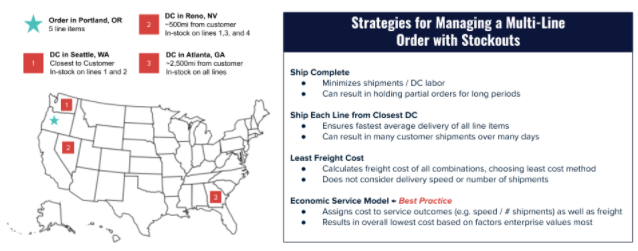
One option commonly seen to minimize the effects of local stockouts is to ship material from one facility that has the needed inventory to the facility closest to the customer.  However, this approach will significantly increase freight costs, transit time / distance, and shipment counts per order, as well as causing higher rates of damage and return. The below details 4 different strategies for managing a multi-line order and an approach we would recommend using. This can also be seen in the graphic below or in the full presentation here

1) Ship Complete

• Minimizes shipments / DC labor

• Can result in holding partial orders for long periods

2) Ship Each Line from Closest DC

• Ensures fastest average delivery of all line items

• Can result in many customer shipments over many days

3) Least Freight Cost

• Calculates freight cost of all combinations, choosing least cost method

• Does not consider delivery speed or number of shipments

4) Economic Service Model (Hydrian recommendation)

• Assigns cost to service outcomes (e.g. speed / # shipments) as well as freight

• Results in overall lowest cost based on factors enterprise values most

Fill rate vs. In-stock rate: What’s the difference and why it matters?

Fill Rate vs In-Stock Rate: What’s the Difference and Why It Matters

At the start of any engagement with a client, one of our first tasks is to agree on the language we’ll use to talk about inventory performance. One of the most important metrics is how much of your product is in-stock and available for sale to customers each day. In this post, we’ll talk through different ways to measure in-stock performance, how to calculate each one, and how each one can help you improve customer service in different ways.

Definitions

A sample of terms we hear clients use to talk about inventory performance include:

• Fill rate

• Backorder Rate

• In-Stock Rate

• Service Level

While each of the terms above has a textbook definition, we’ve found that it’s rare for clients to use that exact definition in their operation. Below, we’ll stick to the most common usage of each.

Fill Rate / Backorder Rate

Fill rate and backorder rate both refer to the percentage of actual demand from customers that you were able to fill immediately from inventory on the shelf. In companies that do not allow backordering, order lines that cannot be filled from stock are generally cancelled, and the customer is notified.

For example, assume a customer orders 100 units of an item, and you only have 50 in stock. You ship the 50 and backorder or cancel (depending on your policy) the remaining 50 units. In this case, you have a unit fill rate of 50% (from here on out we will use “fill rate” to mean both fill rate and backorder rate).

Unit, Line, and Order Fill Rate Examples

In the example above, we are using units shipped from stock for our fill rate. Many companies will instead measure their line fill rate. The difference is that 100% of the units on a line must be in-stock for that line to count as in-stock. So if a customer placed a 10 line order and all lines were fully in stock except the one above, that order would have a 90% line fill rate – we don’t get any credit for the 50 unit partial fill.

An order fill rate works the same way – all units on all lines of the order must be 100% in-stock in order for the order to count as in-stock. If we received 10 customer orders and all but the order above were 100% in-stock, we’d end up with a 90% order fill rate. We don’t get any credit for the 9 perfect lines on that last order, because the 10th line only had a 50% unit fill rate. Another term for order fill rate is “perfect order rate” since from the customer’s perspective, a successfully filled order, where all units on all lines are in-stock, is the best possible outcome.

We’d recommend tracking all three – unit, line, and order fill rate. Unit fill rate is the standard in many industries, but it can be dominated by low-impact items if you sell some SKUs at extremely high quantities relative to others. Line fill rates can correct for that sort of bias. Finally, order fill rates are probably the best measure of a total customer service success.

In-Stock Rate

In-stock rate measures the percentage of expected demand that you have in-stock and available for sale. There are two major implications of using expected demand, rather than actual demand, as an inventory metric:

1) In-stock rates are generally based on a sales forecast, and as such, are subject to forecast error. For example, if you haven’t sold an item for a couple of months, you may have a zero forecast and won’t “ding” yourself if you are out of stock on that item. Of course, that doesn’t mean that a customer won’t buy that item. The broader and longer the “tail” of low volume items in your catalog, the less reliable in-stock rate will be as a metric.

2) In almost every business we work with, sales are depressed when an item is out of stock. Even among companies that don’t purport to advertise or share inventory status with customers, we see fewer orders arrive on days when items are out of stock vs in-stock. What this means is that fill rate (which measures only actual demand from customers) is going to be a falsely optimistic measure of performance, since you can’t have a backorder if the customer never bought the item! This is the main reason to utilize in-stock rates as well as fill rates in your metrics. (We’ll do a future article on “spill rate” which will allow you to quantify the financial impact of lost sales when out of stock.)

When is an Item In-Stock?

Generally, we recommend counting an item as in-stock if it has at least one day of expected demand or the median customer order quantity (whichever is greater) in stock at the start of the day. However, we find that unless you run an extremely tight inventory, the result you get using this method will be extremely close to the result achieved if you count any item that has any units available as in-stock.

Weighting In-Stock Rate

Most of our clients that utilize in-stock rate track this metric for each sales velocity class. For example, they will have an in-stock rate for A, B, C, and F items. While this is a good start, we strongly recommend weighting in-stock rate by sales volume at the item level.

For instance, if you have an item that sold 80 times in the last 90 days, and another item that sold 20 times, both may be “A” items. But the former item is four times more impactful to customer service if it is out of stock. A single, weighted in-stock rate is usually the best indicator of overall customer experience.

Simply take all the SKUs you stock, find the percentage that are in-stock on a given day, and then weight that percentage by each item’s forecast, recent sales, or some other volume indicator. We recommend weighting by order lines rather than units if possible, and find that lines sold during a rolling 90 day period is a good measure.

Service Level

Service level is a term that has a wide range of definitions among our clients. Generally, it refers to either the fill rate, backorder rate, or in-stock rate… depending on which of those metrics the client in question tends to prioritize. So feel free to be as liberal as you like with this term.