From logistics, delays, product returns, and “spilled orders” to customer trust and brand loyalty.
Why do some customers keep coming back to the same brand? Chances are, it’s because that business delivers a promised level of satisfaction and fulfillment. Simply, its products are consistently available when its customers desire them. When customers buy from you, they’re placing trust that your brand fulfills their needs.
Customers start to lose faith when you can’t meet those expectations, whether due to stockouts or other fulfillment issues. They may even decide to take their business elsewhere. A study by Boston Consulting Group found that 43 percent of customers say they would leave a company after just one bad experience.
A recent report from Bain & Company, along with Earl Sasser of the Harvard Business School, also discovered that increasing customer retention rates by just five percent might lead to an increase in profits ranging from 25 percent to 95 percent. Correspondingly, when companies can reduce their customer churn rate by five percent, it results in a 25 to 125 percent increase in profits.
What can you do to maintain customer loyalty?
An excellent place to start is improving your supply chain and fulfillment processes to experience fewer product stockouts. Understanding stock availability levels – and your associated fill and cancel rates – is an important beginning. With this visibility, you may take steps to correct purchasing errors and improve forecasting, so products are consistently available when customers need them.
Quantify your stockout costs
Importantly, stockouts carry real and attributable costs that can be defined. These include: increased shipping costs, return costs, cancellation costs, lost revenue from “spilled” orders (i.e., orders lost to stock unavailability), and, of course, the costs associated with customer attrition due to brand dissatisfaction.
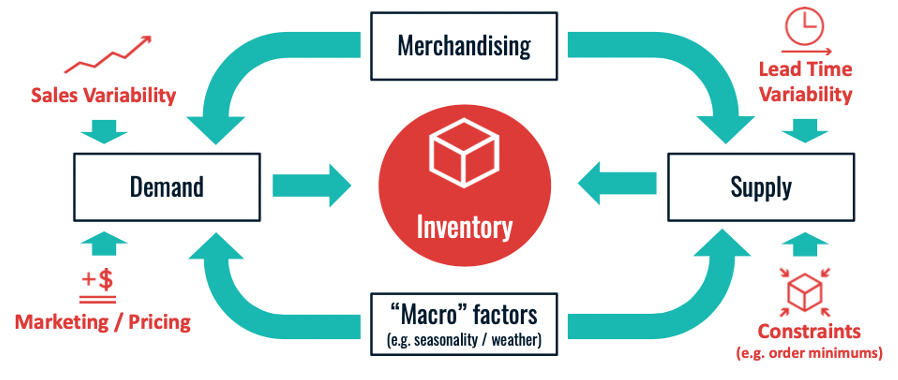
In the simplest terms, excess stockouts occur when your inventory can’t cover the expected variability in your demand. . Inventory optimization is your buffer against the natural uncertainty of supply and demand.
Begin by considering:
Your stock availability rate
Stock availability or in-stock rate measures the percentage of expected demand that you have in-stock and available for sale.
For example, if a SKU has a daily forecast of 2 customer orders for every ten units, and there are 20 units in-stock, we count that item as “in stock” for that day, a 100% availability rate. Learn more about how to calculate in-stock rates here.
Your fill rate
Fill rate is the percentage of actual demand from customers that you were able to fill immediately from inventory on the shelf.
For example, if today two customers order a SKU at five units each, and there are only five units in stock, our fill rate is 50%. Learn more about how to calculate your fill rate here.
Your cancel rate
This is the percentage of demand canceled out of all demand. As you analyze your canceled orders over a set period of time, make sure to not count orders fulfilled later as cancels too.
Local stockout considerations
Most people think of stockouts occurring only when there is no inventory available in their entire supply network (we would refer to this as a “global stockout”). Though “global stockouts” are problematic and certainly expensive, we find that “local stockouts” are just as insidious.
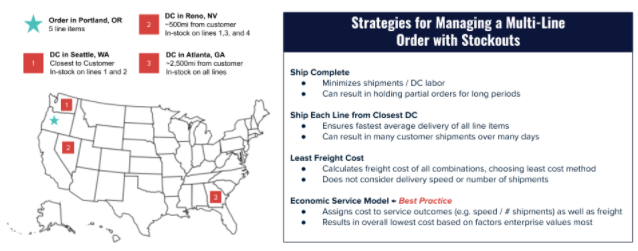
With a local stockout, the SKU is not available at the optimal distribution center closest to the customer. This means that at a minimum, the order will travel further, at higher cost, with longer delivery time and a higher chance of damage. More importantly, on multi-line orders, orders can become split into multiple shipments arriving over multiple days. This is not only more expensive – it’s also less convenient for the customer.
If your business does not permit splitting orders and instead holds orders to ship complete then an order will be delayed until the right item is in-stock at your local distribution center (which could have also required a one-off transfer from the facility that did have inventory). When local stockouts impact multi-line orders, the shipping and delivery time costs compound greatly.
Of course, a measurable percentage of delayed shipments resulting from local stockouts will be canceled during leadtime, adding both return shipping and other restock costs to the lost sale itself.
Moving beyond these tactical financial consequences, a more strategic calculation of stockout costs may be understood by quantifying what we call “spilled” orders – those sales lost when a customer chooses to NOT buy due to stock unavailability.
Calculating “spilled orders”
Quantifying the value of your spilled orders – orders lost when customers can’t buy unavailable products – represents the most significant portion of stockout costs.
Follow the three steps below for a designated range of SKUs to calculate this spill. (For organizations new to spill rate concepts, we recommend starting with a discreet product line, or perhaps a single vendor.)
1. Gather study data for a discreet inventory range and time period
• We’d recommend compiling your daily available quantities for your SKUs for at least 30 days.
• For this same period, find your daily sales history for these SKUs.
2. Filter this inventory data to only include items that had days of available inventory for sale (in-stock days) as well as days without inventory available for sale (out-of-stock days).
• From your daily stock quantities, identify and include only those items with at least one global in-stock and one global out-of-stock day during your study period. Then correlate your daily sales histories for these same items. Combine your filtered sales and filtered inventory data for final calculations into a single data set.
3. Analyze your data to calculate spill cost and spill rate
• Calculate the average sales per day during your study period for each SKU when in-stock and when out-of-stock. The sales difference between in-stock and out-of-stock days is the spill cost for that item during the period.
• When you represent this sales difference between in-stock days and out-of-stock days as a percentage, you find your spill rate (the percentage of sales lost when out of stock) – an incredibly useful and powerful metric for your inventory optimization strategies.
What about intangible stockout costs?
Finally, it’s also essential to calculate the intangible costs associated with your stockouts, such as managing cancellations or backorders, as well as those related to diminished brand reputation.
Key factors to consider with cancellations include service calls, product returns, and unsaleable stock. For your brand, it’s crucial to quantify impacts on customer lifetime value too.
In our experience, these “intangible” costs typically range as high as 5% of revenue for high-stockout product lines.
Adding it all up
It is without question that all businesses understand stockouts have a “cost” which includes additional shipping, customer dissatisfaction, return and cancellation processing, and lost revenue. However, having tangible data that explicitly states these stockout costs can be invaluable when designing inventory strategy. For example, to know that $1M in added inventory will increase fill rate by 5% and result in a $10M revenue bump makes the decision to add that inventory a no-brainer.
The focus of this blog has related explicitly to calculating spilled orders or lost revenue when out of stock because this is often the largest stockout cost, but the hardest to determine.
Here’s a simple example utilizing a $10 fixed cost for every spilled or lost order.
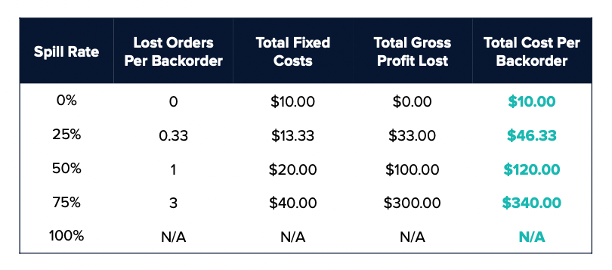
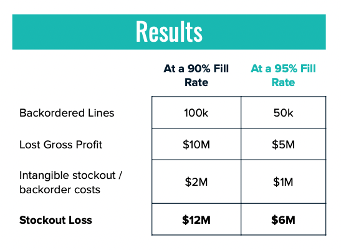
As you can see with this analysis, the costs quickly add up. For an organization with $100M in inventory and a 50% spill rate, the financial impacts of just a 5% fill rate increase equate to $6M.
Cost of Stockout: Dollars and sense
When stockouts occur, there are many costs, ranging from readily tangible additions for freight, shipping delays, and customer returns to measurable yet less apparent financial impacts from tarnished brand reputations and diminished customer loyalty.
Again, in our experience, just the brand and customer loyalty costs typically amount to nearly 5% of revenue for stockout product lines.
At Hydrian, we understand that stockouts carry real and attributable costs and that fully quantifying them is a vital first step for any business’s inventory optimization journey.
Hydrian’s supply chain, analytics, and data-science experts then act as an extension of your team. Together, we develop achievable goals to optimize your inventory and work with you to accomplish them.