Fill Rate vs. In-Stock Rate:
Rethinking How Distributors Measure Service Performance
Library
Demand Planning
Distribution
E-commerce
Inventory Management
Stock Optimization
Video
Why strong service metrics can still hide lost sales
Many distributors report strong fill rates. On paper, the service looks good.
Yet those same businesses still face incomplete orders, frustrated customers, and lost sales. The problem isn’t effort or intent; it’s how service is measured.
Fill rate is widely used, but it tells only part of the story. Without an in-stock rate for context, it can create false confidence, hiding inventory gaps that hurt sales and customer experience.
Knowing the difference between these two metrics is crucial for any organization that wants to improve service without just piling on more inventory.
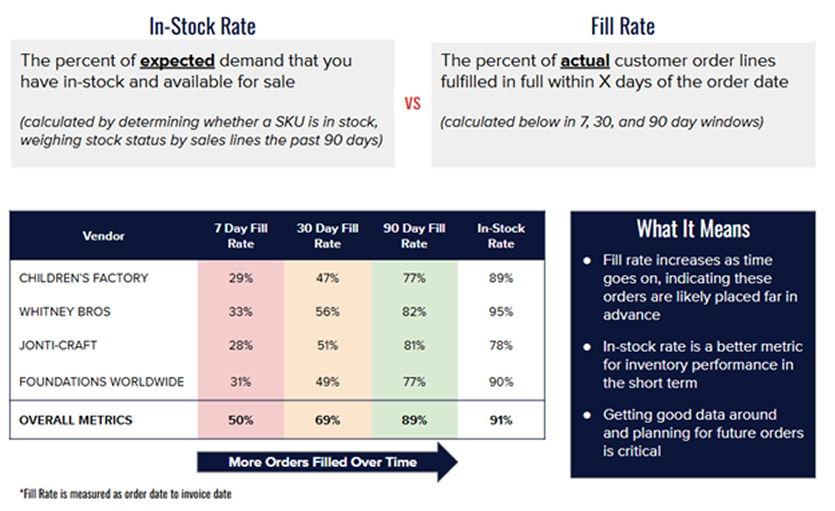
Fill rate: a measure of fulfilled demand.
Fill rate measures how well inventory meets demand.
If a customer orders 100 units and 95 are available, the fill rate is 95%. You can measure fill rate by quantity, revenue, or at the order level. Each approach offers a different perspective, but they all answer the same question: how much demand did we satisfy?
That makes fill rate useful for operations, but it has limits. It only reflects sales that happened, not the demand you never saw.
In stock rate: a measure of demand readiness
In-stock rate approaches the problem from a different angle. Rather than focusing on what was sold, it evaluates whether inventory was available when demand was likely to occur.
This usually means weighting items by recent activity, such as how often they sold or how much revenue they generated over a set period. The result is a metric that shows how well inventory is set up to meet expected, not just observed, demand.
Importantly, the in-stock rate captures the impact of stockouts even when no transactions occur. If a frequently purchased item is unavailable, the metric reflects that gap regardless of whether a customer attempted to buy it.
The gap: where performance appears strong but is not
This distinction becomes critical in environments where demand is not fully visible.
Consider a distributor that doesn’t accept back orders. Fill rate might always show 95% or better, but the business could still be out of stock on important items.
Customers quickly learn which items aren’t reliable. Instead of placing partial orders, they wait, buy elsewhere, or just give up. None of that lost demand shows up in the fill rate.
The in-stock rate corrects for this by penalizing stockouts for items with recent demand history. It highlights gaps that would otherwise remain invisible in traditional reporting.
How measurement choices can distort reality
Even when both metrics are tracked, how they are constructed can lead to misleading conclusions.
A revenue-weighted in-stock rate might look good if high-value items are always available. But that can mask the limited availability of low-cost, high-frequency items that customers rely on to complete their orders.
For example, a contractor might be able to buy an expensive part, but if the supporting pieces are missing, the order falls through. To the customer, service failed, no matter what the metric says.
Similarly, quantity-based fill rate might look fine, but order-level fill rate could show that full orders often go unfilled. Each metric is accurate, but neither alone tells the whole story.
From measurement to action
The real value of these metrics isn’t the report; it’s how they guide your decisions.
When you track fill rate and in-stock rate together, patterns emerge. You can see where demand is missing, where inventory is off, and where buying decisions aren’t matching how customers shop.
That’s when a structured approach to inventory optimization matters. By pairing detailed demand analysis with practical tweaks to purchasing, lead times, and restocking, companies can address the real causes of service gaps rather than just react to symptoms.
Closing thought
Service level isn’t just a number. It’s about how well your inventory actually supports everything your customers want.
Fill rate is still important, but without the in-stock rate, it only tells part of the story. Companies that measure both and understand what each means can improve service, reduce excess inventory, and capture missed sales.
The difference is subtle, but the impact is big. It’s the gap between thinking service is strong and actually knowing where to improve it.
You might also like

Fill Rate vs. In-Stock Rate: Rethinking How Distributors Measure Service Performance

Why is forecasting not a model problem

When the Weak Link Is Upstream: Tackling Supplier and Sourcing Challenges in 2025
Subscribe to our newsletter
Get updates on the latest news across all core inventory-related processes.
Subscribe now!
Subscribe
Your email is safe with us, we dont spam.