
Presented at Home Delivery World 2021
Before beginning, it is important to define two different types of stockouts in a network with multiple distribution centers:
There is obviously a cost to global stockouts which is fairly straightforward to understand, but there is also a dramatic cost to local stockouts. Based on experience with our customers, the measurable cost of a local stockout in a national, multiple distribution center network consists of the below, (this does not account for costs associable to intangibles such as diminished brand reputation or customer lifetime lost value):
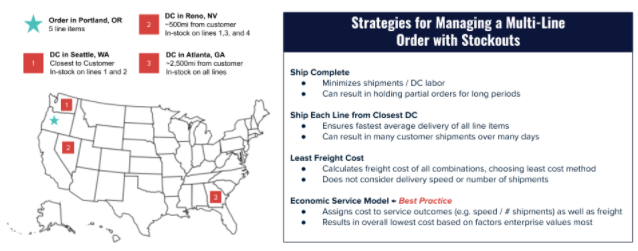
One option commonly seen to minimize the effects of local stockouts is to ship material from one facility that has the needed inventory to the facility closest to the customer. However, this approach will significantly increase freight costs, transit time / distance, and shipment counts per order, as well as causing higher rates of damage and return. The below details 4 different strategies for managing a multi-line order and an approach we would recommend using. This can also be seen in the graphic below or in the full presentation here.
Contact us to learn more.


Get updates on the latest news across all core inventory-related processes.
Subscribe now!
Your email is safe with us, we dont spam.
