Calculating the cost of a stockout

From logistics, delays, product returns, and “spilled orders” to customer trust and brand loyalty.

Why do some customers keep coming back to the same brand? Chances are, it’s because that business delivers a promised level of satisfaction and fulfillment. Simply, its products are consistently available when its customers desire them. When customers buy from you, they’re placing trust that your brand fulfills their needs.

Customers start to lose faith when you can’t meet those expectations, whether due to stockouts or other fulfillment issues. They may even decide to take their business elsewhere. A study by Boston Consulting Group found that 43 percent of customers say they would leave a company after just one bad experience.

A recent report from Bain & Company, along with Earl Sasser of the Harvard Business School, also discovered that increasing customer retention rates by just five percent might lead to an increase in profits ranging from 25 percent to 95 percent. Correspondingly, when companies can reduce their customer churn rate by five percent, it results in a 25 to 125 percent increase in profits.

What can you do to maintain customer loyalty?

An excellent place to start is improving your supply chain and fulfillment processes to experience fewer product stockouts. Understanding stock availability levels – and your associated fill and cancel rates – is an important beginning. With this visibility, you may take steps to correct purchasing errors and improve forecasting, so products are consistently available when customers need them.

Quantify your stockout costs

Importantly, stockouts carry real and attributable costs that can be defined. These include: increased shipping costs, return costs, cancellation costs, lost revenue from  “spilled” orders (i.e., orders lost to stock unavailability), and, of course, the costs associated with customer attrition due to brand dissatisfaction.

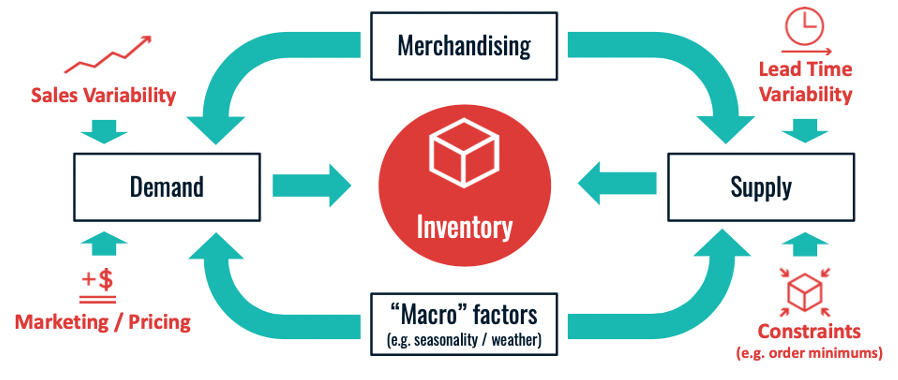
In the simplest terms, excess stockouts occur when your inventory can’t cover the expected variability in your demand. . Inventory optimization is your buffer against the natural uncertainty of supply and demand.

Inventory_merchandising

Begin by considering:

Your stock availability rate

Stock availability or in-stock rate measures the percentage of expected demand that you have in-stock and available for sale.

For example, if a SKU has a daily forecast of 2 customer orders for every ten units, and there are 20 units in-stock, we count that item as “in stock” for that day, a 100% availability rate. Learn more about how to calculate in-stock rates here.

Your fill rate

Fill rate is the percentage of actual demand from customers that you were able to fill immediately from inventory on the shelf.

For example, if today two customers order a SKU at five units each, and there are only five units in stock, our fill rate is 50%. Learn more about how to calculate your fill rate here.

Your cancel rate

This is the percentage of demand canceled out of all demand. As you analyze your canceled orders over a set period of time, make sure to not count orders fulfilled later as cancels too.

Learn More

Local stockout considerations

Most people think of stockouts occurring only when there is no inventory available in their entire supply network (we would refer to this as a “global stockout”). Though “global stockouts” are problematic and certainly expensive, we find that “local stockouts” are just as insidious.

With a local stockout, the SKU is not available at the optimal distribution center closest to the customer. This means that at a minimum, the order will travel further, at higher cost, with longer delivery time and a higher chance of damage. More importantly, on multi-line orders, orders can become split into multiple shipments arriving over multiple days. This is not only more expensive – it’s also less convenient for the customer.

If your business does not permit splitting orders and instead holds orders to ship complete then an order will be delayed until the right item is in-stock at your local distribution center (which could have also required a one-off transfer from the facility that did have inventory). When local stockouts impact multi-line orders, the shipping and delivery time costs compound greatly.

Of course, a measurable percentage of delayed shipments resulting from local stockouts will be canceled during leadtime, adding both return shipping and other restock costs to the lost sale itself.

Moving beyond these tactical financial consequences, a more strategic calculation of stockout costs may be understood by quantifying what we call “spilled” orders – those sales lost when a customer chooses to NOT buy due to stock unavailability.

Calculating “spilled orders”

Quantifying the value of your spilled orders – orders lost when customers can’t buy unavailable products – represents the most significant portion of stockout costs.

Follow the three steps below for a designated range of SKUs to calculate this spill. (For organizations new to spill rate concepts, we recommend starting with a discreet product line, or perhaps a single vendor.)

1. Gather study data for a discreet inventory range and time period

• We’d recommend compiling your daily available quantities for your SKUs for at least 30 days.

• For this same period, find your daily sales history for these SKUs.

2. Filter this inventory data to only include items that had days of available inventory for sale (in-stock days) as well as days without inventory available for sale (out-of-stock days).

• From your daily stock quantities, identify and include only those items with at least one global in-stock and one global out-of-stock day during your study period. Then correlate your daily sales histories for these same items. Combine your filtered sales and filtered inventory data for final calculations into a single data set.

3. Analyze your data to calculate spill cost and spill rate

• Calculate the average sales per day during your study period for each SKU when in-stock and when out-of-stock. The sales difference between in-stock and out-of-stock days is the spill cost for that item during the period.

• When you represent this sales difference between in-stock days and out-of-stock days as a percentage, you find your spill rate (the percentage of sales lost when out of stock) – an incredibly useful and powerful metric for your inventory optimization strategies.

What about intangible stockout costs?

Finally, it’s also essential to calculate the intangible costs associated with your stockouts, such as managing cancellations or backorders, as well as those related to diminished brand reputation.

Key factors to consider with cancellations include service calls, product returns, and unsaleable stock. For your brand, it’s crucial to quantify impacts on customer lifetime value too.

In our experience, these “intangible” costs typically range as high as 5% of revenue for high-stockout product lines.

Learn More

Adding it all up

It is without question that all businesses understand stockouts have a “cost” which includes additional shipping, customer dissatisfaction, return and cancellation processing, and lost revenue. However, having tangible data that explicitly states these stockout costs can be invaluable when designing inventory strategy. For example, to know that $1M in added inventory will increase fill rate by 5% and result in a $10M revenue bump makes the decision to add that inventory a no-brainer.

The focus of this blog has related explicitly to calculating spilled orders or lost revenue when out of stock because this is often the largest stockout cost, but the hardest to determine.

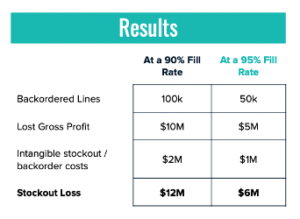
Here’s a simple example utilizing a $10 fixed cost for every spilled or lost order.

Inventory_Chart

As you can see with this analysis, the costs quickly add up. For an organization with $100M in inventory and a 50% spill rate, the financial impacts of just a 5% fill rate increase equate to $6M.

Optimization_results

Cost of Stockout: Dollars and sense

When stockouts occur, there are many costs, ranging from readily tangible additions for freight, shipping delays, and customer returns to measurable yet less apparent financial impacts from tarnished brand reputations and diminished customer loyalty.

Again, in our experience, just the brand and customer loyalty costs typically amount to nearly 5% of revenue for stockout product lines.

At Hydrian, we understand that stockouts carry real and attributable costs and that fully quantifying them is a vital first step for any business’s inventory optimization journey.

Powered by our proprietary AI tech built upon decades of experience, we begin with a no-cost Inventory Assessment.

Hydrian’s supply chain, analytics, and data-science experts then act as an extension of your team. Together, we develop achievable goals to optimize your inventory and work with you to accomplish them.

Let’s get started.

How stockouts impact freight cost

Presented at Home Delivery World 2021

Before beginning, it is important to define two different types of stockouts in a network with multiple distribution centers:

1) Local Stockouts: Out of stock at the “best” or closest distribution center to the customer but in-stock in other distribution centers across the networ

2) Global Stockouts: Out of stock at all distribution centers in the network

There is obviously a cost to global stockouts which is fairly straightforward to understand, but there is also a dramatic cost to local stockouts. Based on experience with our customers, the measurable cost of a local stockout in a national, multiple distribution center network consists of the below, (this does not account for costs associable to intangibles such as diminished brand reputation or customer lifetime lost value): 

• 20% of order lines ship from non-local distribution centers 

• 15% of orders have 2+ shipments due to splits caused by the local stockout

• 2.5 additional zones are traveled on average for non-local shipments at a 20-25% freight cost premium

• 1.8 days of additional delivery time is added on average

• 14% of total outbound freight cost is attributable solely to the local stockout

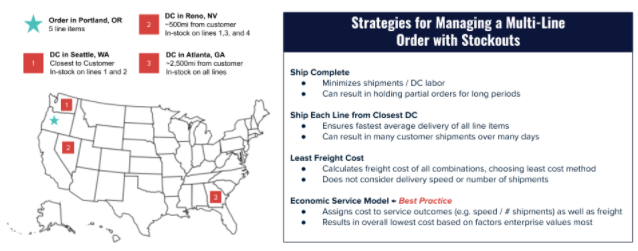
One option commonly seen to minimize the effects of local stockouts is to ship material from one facility that has the needed inventory to the facility closest to the customer.  However, this approach will significantly increase freight costs, transit time / distance, and shipment counts per order, as well as causing higher rates of damage and return. The below details 4 different strategies for managing a multi-line order and an approach we would recommend using. This can also be seen in the graphic below or in the full presentation here

1) Ship Complete

• Minimizes shipments / DC labor

• Can result in holding partial orders for long periods

2) Ship Each Line from Closest DC

• Ensures fastest average delivery of all line items

• Can result in many customer shipments over many days

3) Least Freight Cost

• Calculates freight cost of all combinations, choosing least cost method

• Does not consider delivery speed or number of shipments

4) Economic Service Model (Hydrian recommendation)

• Assigns cost to service outcomes (e.g. speed / # shipments) as well as freight

• Results in overall lowest cost based on factors enterprise values most

Fill rate vs. In-stock rate: What’s the difference and why it matters?

Fill Rate vs In-Stock Rate: What’s the Difference and Why It Matters

At the start of any engagement with a client, one of our first tasks is to agree on the language we’ll use to talk about inventory performance. One of the most important metrics is how much of your product is in-stock and available for sale to customers each day. In this post, we’ll talk through different ways to measure in-stock performance, how to calculate each one, and how each one can help you improve customer service in different ways.

Definitions

A sample of terms we hear clients use to talk about inventory performance include:

• Fill rate

• Backorder Rate

• In-Stock Rate

• Service Level

While each of the terms above has a textbook definition, we’ve found that it’s rare for clients to use that exact definition in their operation. Below, we’ll stick to the most common usage of each.

Fill Rate / Backorder Rate

Fill rate and backorder rate both refer to the percentage of actual demand from customers that you were able to fill immediately from inventory on the shelf. In companies that do not allow backordering, order lines that cannot be filled from stock are generally cancelled, and the customer is notified.

For example, assume a customer orders 100 units of an item, and you only have 50 in stock. You ship the 50 and backorder or cancel (depending on your policy) the remaining 50 units. In this case, you have a unit fill rate of 50% (from here on out we will use “fill rate” to mean both fill rate and backorder rate).

Unit, Line, and Order Fill Rate Examples

In the example above, we are using units shipped from stock for our fill rate. Many companies will instead measure their line fill rate. The difference is that 100% of the units on a line must be in-stock for that line to count as in-stock. So if a customer placed a 10 line order and all lines were fully in stock except the one above, that order would have a 90% line fill rate – we don’t get any credit for the 50 unit partial fill.

An order fill rate works the same way – all units on all lines of the order must be 100% in-stock in order for the order to count as in-stock. If we received 10 customer orders and all but the order above were 100% in-stock, we’d end up with a 90% order fill rate. We don’t get any credit for the 9 perfect lines on that last order, because the 10th line only had a 50% unit fill rate. Another term for order fill rate is “perfect order rate” since from the customer’s perspective, a successfully filled order, where all units on all lines are in-stock, is the best possible outcome.

We’d recommend tracking all three – unit, line, and order fill rate. Unit fill rate is the standard in many industries, but it can be dominated by low-impact items if you sell some SKUs at extremely high quantities relative to others. Line fill rates can correct for that sort of bias. Finally, order fill rates are probably the best measure of a total customer service success.

In-Stock Rate

In-stock rate measures the percentage of expected demand that you have in-stock and available for sale. There are two major implications of using expected demand, rather than actual demand, as an inventory metric:

1) In-stock rates are generally based on a sales forecast, and as such, are subject to forecast error. For example, if you haven’t sold an item for a couple of months, you may have a zero forecast and won’t “ding” yourself if you are out of stock on that item. Of course, that doesn’t mean that a customer won’t buy that item. The broader and longer the “tail” of low volume items in your catalog, the less reliable in-stock rate will be as a metric.

2) In almost every business we work with, sales are depressed when an item is out of stock. Even among companies that don’t purport to advertise or share inventory status with customers, we see fewer orders arrive on days when items are out of stock vs in-stock. What this means is that fill rate (which measures only actual demand from customers) is going to be a falsely optimistic measure of performance, since you can’t have a backorder if the customer never bought the item! This is the main reason to utilize in-stock rates as well as fill rates in your metrics. (We’ll do a future article on “spill rate” which will allow you to quantify the financial impact of lost sales when out of stock.)

When is an Item In-Stock?

Generally, we recommend counting an item as in-stock if it has at least one day of expected demand or the median customer order quantity (whichever is greater) in stock at the start of the day. However, we find that unless you run an extremely tight inventory, the result you get using this method will be extremely close to the result achieved if you count any item that has any units available as in-stock.

Weighting In-Stock Rate

Most of our clients that utilize in-stock rate track this metric for each sales velocity class. For example, they will have an in-stock rate for A, B, C, and F items. While this is a good start, we strongly recommend weighting in-stock rate by sales volume at the item level.

For instance, if you have an item that sold 80 times in the last 90 days, and another item that sold 20 times, both may be “A” items. But the former item is four times more impactful to customer service if it is out of stock. A single, weighted in-stock rate is usually the best indicator of overall customer experience.

Simply take all the SKUs you stock, find the percentage that are in-stock on a given day, and then weight that percentage by each item’s forecast, recent sales, or some other volume indicator. We recommend weighting by order lines rather than units if possible, and find that lines sold during a rolling 90 day period is a good measure.

Service Level

Service level is a term that has a wide range of definitions among our clients. Generally, it refers to either the fill rate, backorder rate, or in-stock rate… depending on which of those metrics the client in question tends to prioritize. So feel free to be as liberal as you like with this term.


Is your fill rate right for your business?

One of the questions we are asked by nearly every new client is: “What should my fill rate (or service level / in-stock rate / backorder rate) be?” Without diving into item-level sales and supply chain data, this is an impossible question to answer, and we strongly caution against trying to set fill rates against an industry benchmark.

We have clients with profit-maximizing fill rates in the 80% range, and clients with profit-maximizing fill rates well above 99%. This is a number that will vary not just by industry and company, but also among the different items sold within a single warehouse. In this article, we’ll talk about the 5 main factors that you should use to determine the right service level for any item in your inventory. In the end, the goal is to reallocate inventory dollars from low-quality items into higher quality, maximizing profit.

1) Profitability

Items that are out of stock will sell less (if at all, depending on a company’s backorder policy). Thus, you want to make sure that the items which return the most profit are also in-stock the most often.

2) Holding Cost

Item that are more expensive to keep in inventory should be more conservatively stocked, which will naturally lead to lower fill rates. For example, all else being equal, you want large, bulky items like bubble wrap to have a lower in-stock target than, say, a small pack of washers with the same cost and margin.

3) Sales Volume and Variance

As said above, many companies target different service levels based on sales volume. This is the right approach. Another thing that should be considered is sales variance. For example, assume two items have the same total sales, but one item sells smoothly and consistently while the other has more “chunky” demand. The more consistent item should have a higher target in-stock rate.

4) Lead Time Length and Variance

Items which have long or highly variant leadtimes are harder to stock efficiently. They require more safety stock, and thus, will have a lower profit-maximizing in-stock target.

5) Strategic Importance

Finally, if an item is an own-brand, “front page” flagship, or otherwise strategically important item, you may want to target a relatively high in-stock rate, no matter how it stacks up using the other metrics above.