
Library
Demand Planning
Distribution
E-commerce
Inventory Management
Stock Optimization
Video
How stockouts impact freight cost
Presented at Home Delivery World 2021
Before beginning, it is important to define two different types of stockouts in a network with multiple distribution centers:
- Local Stockouts: Out of stock at the “best” or closest distribution center to the customer but in-stock in other distribution centers across the network
- Global Stockouts: Out of stock at all distribution centers in the network
There is obviously a cost to global stockouts which is fairly straightforward to understand, but there is also a dramatic cost to local stockouts. Based on experience with our customers, the measurable cost of a local stockout in a national, multiple distribution center network consists of the below, (this does not account for costs associable to intangibles such as diminished brand reputation or customer lifetime lost value):
- 20% of order lines ship from non-local distribution centers
- 15% of orders have 2+ shipments due to splits caused by the local stockout
- 2.5 additional zones are traveled on average for non-local shipments at a 20-25% freight cost premium
- 1.8 days of additional delivery time is added on average
- 14% of total outbound freight cost is attributable solely to the local stockout
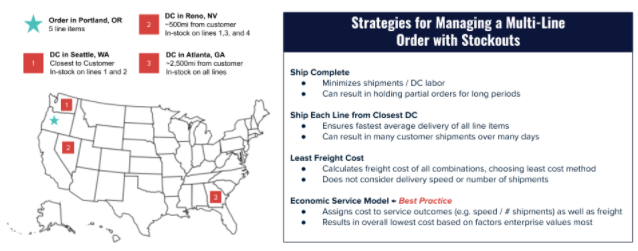
One option commonly seen to minimize the effects of local stockouts is to ship material from one facility that has the needed inventory to the facility closest to the customer. However, this approach will significantly increase freight costs, transit time / distance, and shipment counts per order, as well as causing higher rates of damage and return. The below details 4 different strategies for managing a multi-line order and an approach we would recommend using. This can also be seen in the graphic below or in the full presentation here.
Ship Complete
- Minimizes shipments / DC labor
- Can result in holding partial orders for long periods
Ship Each Line from Closest DC
- Ensures fastest average delivery of all line items
- Can result in many customer shipments over many days
Least Freight Cost
- Calculates freight cost of all combinations, choosing least cost method
- Does not consider delivery speed or number of shipments
Economic Service Model (Hydrian recommendation)
- Assigns cost to service outcomes (e.g. speed / # shipments) as well as freight
- Results in overall lowest cost based on factors enterprise values most
Contact us to learn more.
You might also like

Fill Rate vs. In-Stock Rate: Rethinking How Distributors Measure Service Performance

Why is forecasting not a model problem

When the Weak Link Is Upstream: Tackling Supplier and Sourcing Challenges in 2025

Subscribe to our newsletter
Get updates on the latest news across all core inventory-related processes.
Subscribe now!
Subscribe
Your email is safe with us, we dont spam.
